Selected projects
& results.
Click any project to read the full case study, tools used, key outcomes, and links to GitHub or live application.
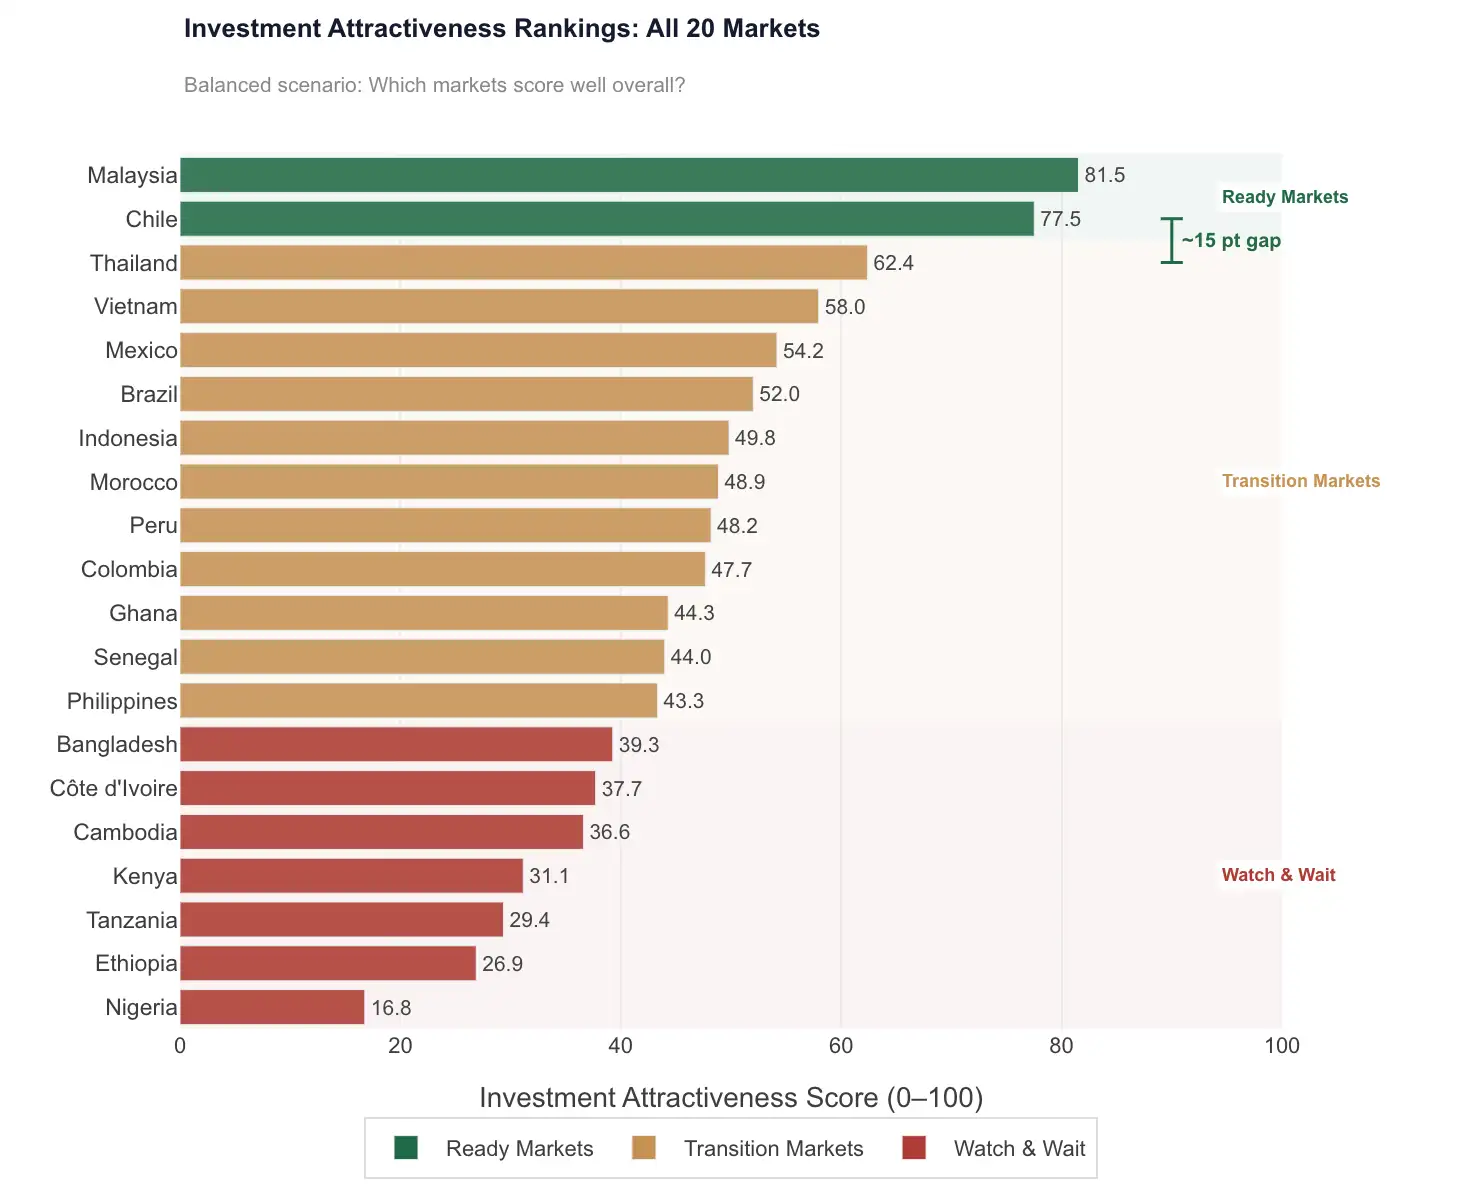
Renewable Energy Investment Analyzer
Quantitative market prioritization framework for renewable energy investment. 20 markets scored across 4 dimensions, 4 investor scenarios tested.
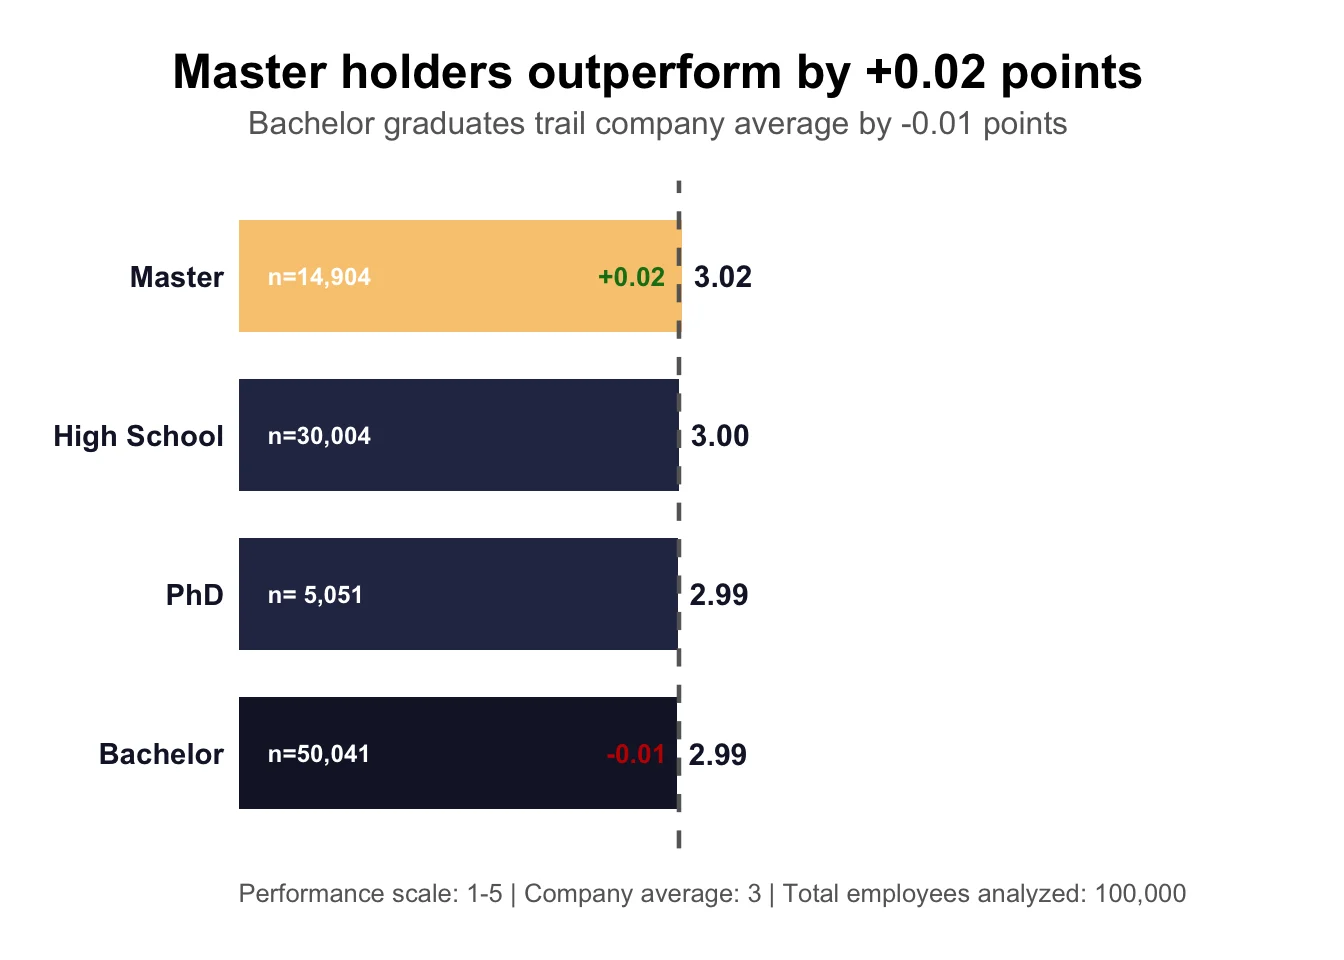
Analyzing Performance Gaps Between Departments
Thematic EDA across 100,000 employee records uncovering drivers of turnover, performance, and compensation equity.

Predictive Demand Analytics — OCP Group
Time series analysis leveraging ARCH/GARCH models for volatility patterns. 97–99% accuracy using XGBoost and LSTM across 14 market variables.
Intercity Transport Feasibility, Guinea & DRC
Cross-border feasibility and scenario analysis for large-scale infrastructure investment with SOGEPA SARL and JTP Transport.
Consumer Sentiment & Facial Coding Analysis
Consumer sentiment analysis and facial coding pipeline for emotional response measurement beyond traditional survey data.